
BMI vs. Mortality
Introduction
The paper "Excess deaths associated with underweight, overweight, and obesity" examines the association between body mass index and total mortality. It, like some other studies, finds that a BMI in the "overweight" range associates with fairly low mortality. In fact, "overweight was associated with a slight reduction in mortality (−86 094 deaths; 95% CI, −161 223 to −10 966) relative to the normal weight category." This contrasts with statements like "the increasing prevalence of overweight and obesity is associated with many diet‐related chronic diseases including diabetes mellitus, cardiovascular disease, stroke, hypertension and certain cancers." To put the debate in oversimplified terms, we have "becoming overweight is healthy" versus "becoming overweight is unhealthy." We could look at ways to resolve these claims:
- The formula for BMI, which takes into account only height and weight, may not measure "fatness" as well as other measurements, like waist circumference or waist‐to‐hip ratio.
- Even ignoring that, the cutoffs between the BMI categories may be misaligned: Maybe "fatness" doesn't appear until a BMI of 27, rather than 25.
- Maybe people in the overweight category suffer from more non‐fatal health problems than those in the normal category.
- Maybe the overweight would suffer more deaths, too, if not for medical treatment, which they may be more likely to seek out or which doctors may be more likely to recommend.
- The people used in this study might not be representative of you or of the world at large.
- The BMI measurements in this study were done only at the beginning of the study. People's BMIs surely changed as time went by.
- And, of course: correlation is not causation.
At the moment, I'm not interested in any of that. What I am interested in is how the numbers were arrived at. One challenge in this kind of study is adjusting for confounding factors. Do people gain weight as they age? If so, if an old, overweight person dies, is it because of his age, his weight, or some interaction between them that neither would produce on its own? Do men weigh more than women? Does smoking reduce weight? To adjust for some of these factors, the model in the "Excess deaths..." paper includes BMI, sex, smoking status, race, and alcohol consumption.
Knowing this, we have to be careful in interpreting the results. Such a model could show, hypothetically, that, while overweight men die more often than those of normal weight, many of the overweight are alcoholics, and the likely cause of their deaths is alcohol, not weight. This doesn't change the fact that, given two men of the same age and BMI, the one with the higher BMI is more likely to die. And the model doesn't contradict that. Indeed, there's nothing wrong with such a model; the question is how we interpret it.
My questions was, without these adjustments, do the results come out the same? Is overweight really associated with a longer life, or does that association hold only for (roughly speaking) "overweight resulting from causes other than alcohol?" (To be fair, on the other side, some people avoid being overweight partially due to smoking.) I downloaded some of the same data used by the "Excess deaths..." study to find out.
This left me with a decision: What factors do I adjust for? I ended up leaving in two factors, sex and age, on the theory that weight may affect the sexes differently and that low weight may be more hazardous among the old. You could also rationalize this choice by saying that these two factors, unlike smoking and alcohol use, aren't under the subject's control. This justification would argue for including race as a factor, but I did not, largely because I didn't want to attempt too complex an analysis and, compared to sex and age, I assumed that the effects of weight changes were least likely to vary by race. (I have no evidence for this assumption.)
Disclaimer
I am not qualified to perform a good statistical analysis. I did this because I was curious about possible alcohol‐weight confounding, but it may not address even that issue competently.
Results
Before we get to the final charts, here's a table that takes only sex and BMI into account, ignoring age:
| Weight class | Male death % | Female death % |
|---|---|---|
| underweight | 34.7 | 39.1 |
| normal | 32.2 | 21.8 |
| overweight | 27.7 | 24.5 |
| obese | 27.3 | 22.1 |
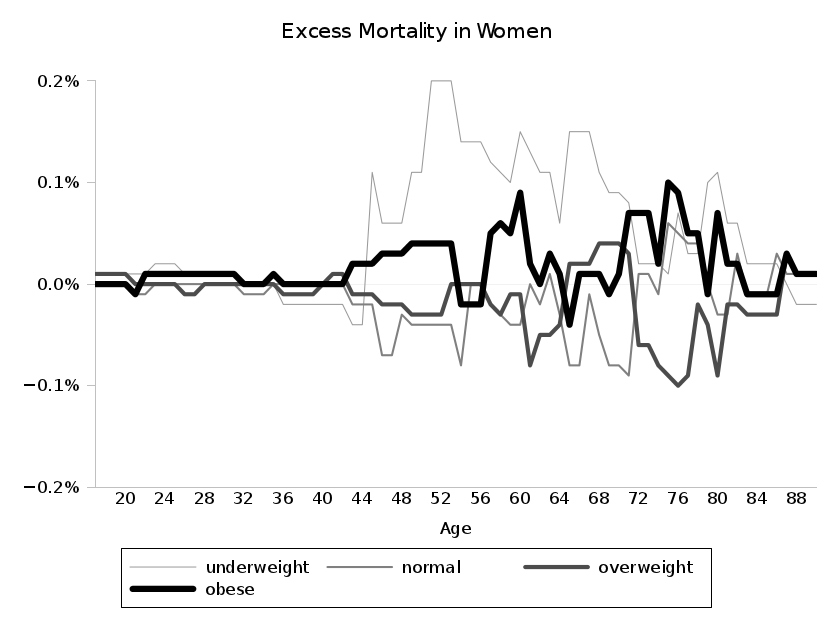
On to the charts. The lines estimate, for each weight class, how much more or less likely a member of that weight class is to have died than average for that sex and age.
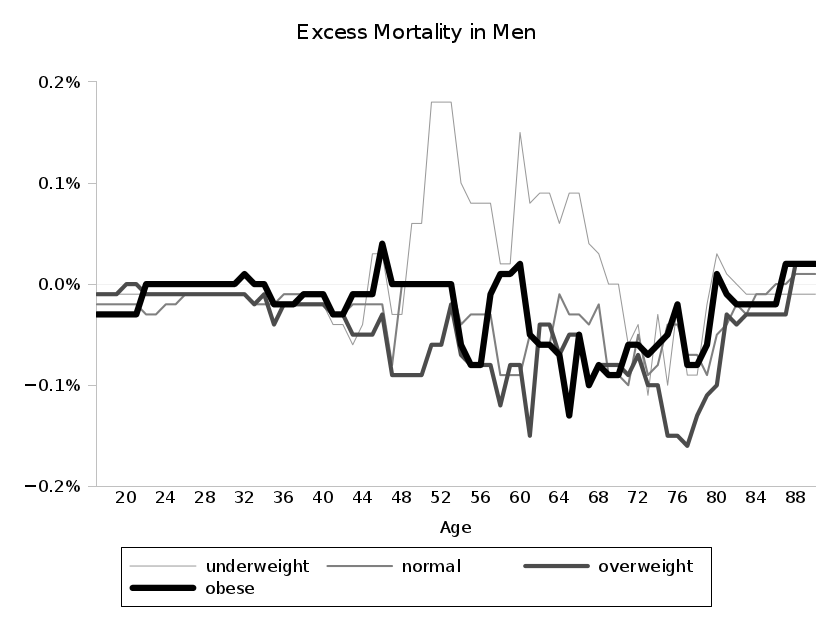
Technical digression: You may notice that the men's chart between 70 and 80 has all negative values. This is obviously bogus. It's an artifact of the way I did the analysis, finding a best‐fit line for each of the weight classes individually and then another best‐fit line for their aggregate. The cutoff points used for the various best‐fit lines are not necessarily the same, so, for example, the age‐71 estimate for all men is an estimate designed for both the 71‐ and 72‐year‐old men in the sample, while the age‐71 estimates for three of the four weight classes are designed only for 71‐year‐olds. Thus, we can't just combine the four weight classes' estimates for age 71 and sometimes 72 to compute the aggregate estimate for ages 71 and 72 total. If the negative numbers feel wrong to you, then focus on the differences between the classes at each point. The highest line is still the weight class with the highest estimated risk at that age. I could instead have graphed the absolute risk estimates for each class; the result would be that, at each age, all data points would be shifted upward by the average mortality at that age. In such a chart, however, the large range of values and the constant shifting of the baseline make it difficult to compare among weight classes, so I've chosen the imperfect charts above.
Conclusions
Mortality among the overweight does appear at least as good as that among those of normal weight, as the more advanced analysis in the paper showed. My fears that alcohol intake made overweight look less dangerous are allayed.
More generally, the associations from the paper (looking exclusively at its NHANES III data, the only data with available publicly mortality information) seem to hold up, with only underweight showing an clear association with mortality. Even then, the difference in mortality between the lowest‐risk group in an age range and the highest‐risk group (often reflecting changes of 50 or more pounds) maxes out at approximately an extra 0.3% chance of death over the approximately 15‐year range of the study.
I refer back to my earlier list of caveats, though, when it comes to drawing conclusions beyond "x is associated with y."
Analysis Program
I don't expect for anyone to want to try this out himself, but I'm posting the details here in something akin to Linus Torvalds's "real men" backup strategy:
Data and Code
Instructions
Run excess.sh; you'll need the data files (named as shown above) in ../data, a wekaisotonic script to run Weka's weka.classifiers.functions.IsotonicRegression classifier, and various Unix commands. It will take about a minute to run, and it will generate a bunch of files, culminating in male.excess and female.excess.